Culinary photography is essentially product photography. Everywhere you look, there will be meals, beverages, and treats. Leaf through any cookbook and you find beautiful images of culinary creations.
Walk into any dining establishment, anytime, anywhere, and you will be presented with their stunning meal images. Instagram is flooded with the most attractive product shots of food imaginable.
Read on to find out exactly what you need to acquire and do to create beautiful images of culinary delights.
What Is Photographing Meals?
Taking pictures of food is one area of photography that has boomed in recent years. People are starting to cook more, and the world of social media has made it possible to show what we are cooking. Or eating.
There are more restaurants than ever, dishing out more kinds of food that you could conceive. All these need photographing. To show, share, persuade, and make your mouth water.
This is our comprehensive manual on everything related to capturing culinary images. We will look at the best cameras to use, the lenses that accompany them and the accessories you will need.
Styling food will be as easy as pie with all our tips and techniques (and sneaky tricks) to make your food pop.
And remember: “There is no sincerer love than the love of food” – Bernard Shaw.
How to Take Photos of Meals
How to capture photography of food at home? You will already have some ideas. You may have even prepared some food, now how do you photograph it?
It all depends on what you want to show. Start by ascertaining what the most important aspects are.
Have you prepared a vast array of meals, showcasing various dishes? If so, an aerial photograph might show off the food in the best possible way.
Are you looking to focus on some minute details? Then a diagonal perspective might work best.
Lighting
The lighting conditions of product and culinary captures are very important. There are three main ideas behind lighting the dishes and foodstuffs you are photographing.
Natural light is free yet sometimes difficult to harness. Huge lighting set-ups or artificial lighting can be organized how you wish but can be very expensive.
A middle ground of using natural light and artificial light can be an option, yet a little trick for white balance.
For some really creative ways of lighting your culinary images, check our article on using your flashgun more creatively.
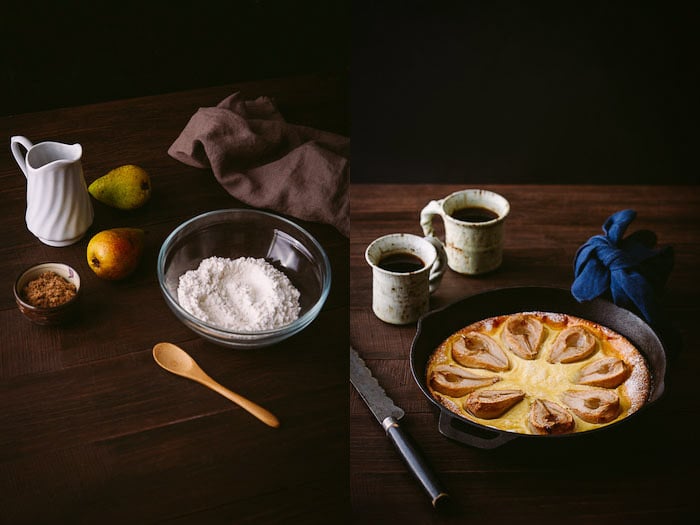
Enhance Your Picture-Taking Skills With Natural Light for Culinary Images
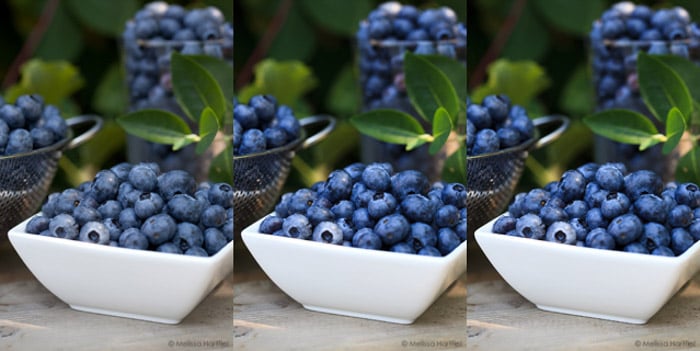
Using natural light might be the best way to start and practice with. It is abundant, free and everyone has a window they can use as their source of direct light. Anyone can improve their capturing of food images with natural light!
This is also available outside for shoots, for example, in a park or on-location.
Indoors you can place a diffuser sits between the window and the food to create an even light fall. It helps to soften shadows and to reduce the intensity of the light source.
Learning how to use reflectors both indoors and out can enhance your culinary image capturing. They can be used to help bounce the light back towards the subject which softens harsh shadows.
By no means is it super easy. But it is by far the cheapest option that works (almost) any time of the day.
Darina Kopcok
Using Studio Lights for Capturing Your Dishes
Sometimes your food photography lighting might need artificial light. This doesn’t have to be complicated. Often, one light will be enough. It’s great for studios with no windows, or times when the sun just isn’t as strong as you want it to be.
Finding the best lighting kits for capturing images doesn’t have to be difficult or expensive. The softboxes are pretty inexpensive, easy to put up and pack away. It is a viable choice.
Using one light will leave you one set of shadows. By combining the light source with reflectors helps to minimalize these harsh areas. You’ll have more detail to play around with.
Softboxes give a constant flow of light. They can be moved to obtain different angles or muting an otherwise harsh light.
Composition
The next thing to think about is culinary photography composition. This is where we learn how to arrange the meals and related items to be photographed.
One composition to look at is using the Fibonacci spiral. Arranging your culinary items along a curved line rather than a straight line creates flow and movement.
It will gently guide your viewer's eye around the image. This works particularly well for overhead shots when there are several elements that make up the image.
In the picture of the chicken biryani below, the curves of the bowls lead the eye to the center of the main dish.
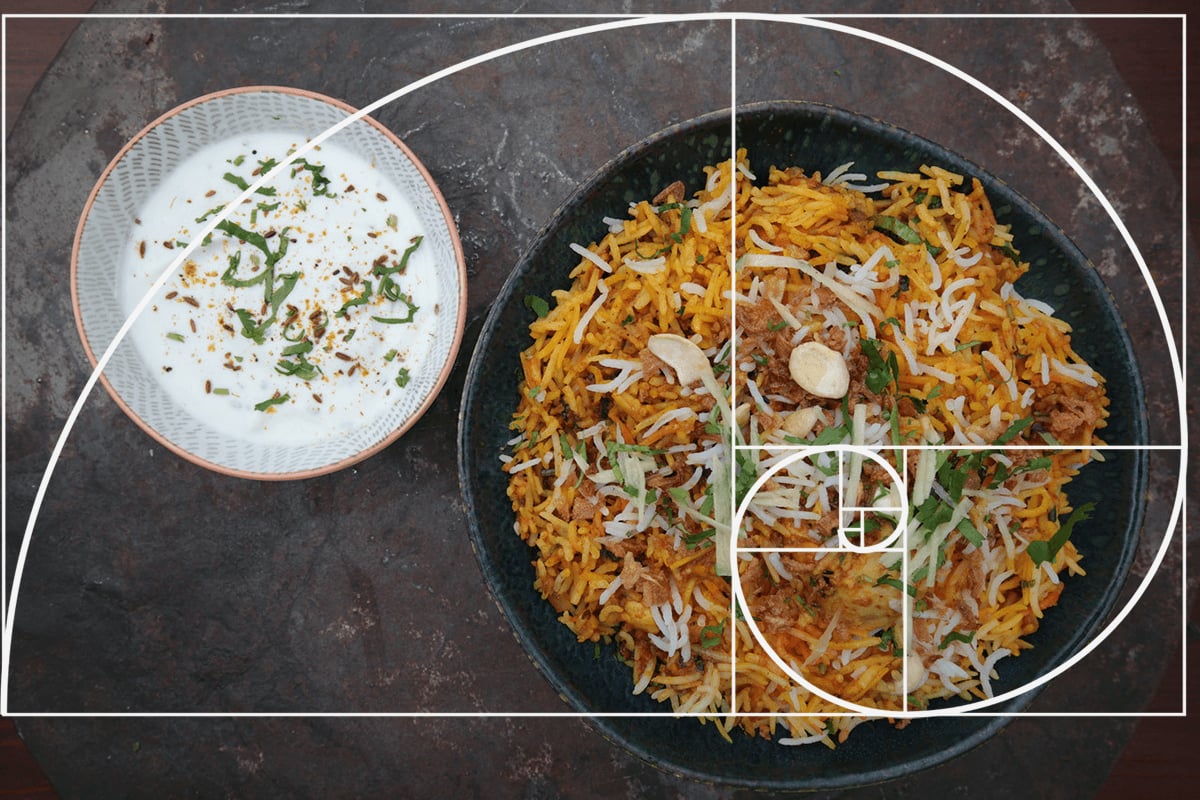
© T P E Marshall
Selecting the Ideal Angles for Capturing Culinary Images
Sometimes the camera angle you choose will be dictated by the shoot. The chicken biryani above was for an online meal delivery service. Each dish had to be shot from above.
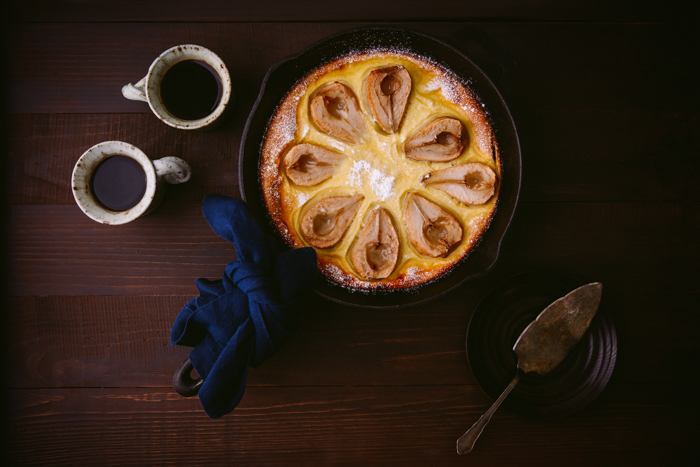
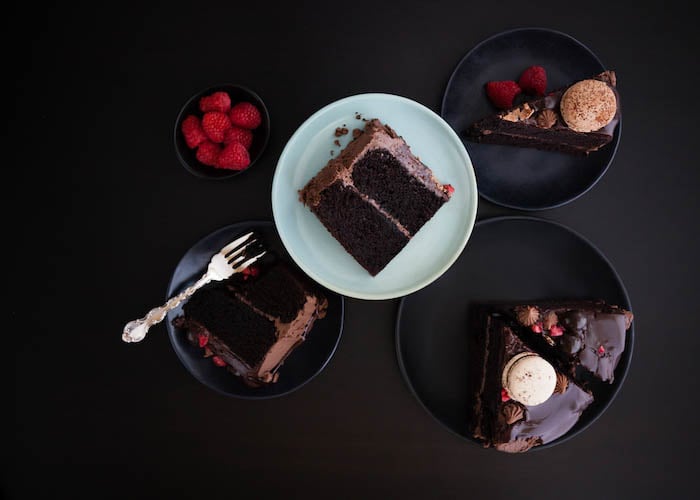
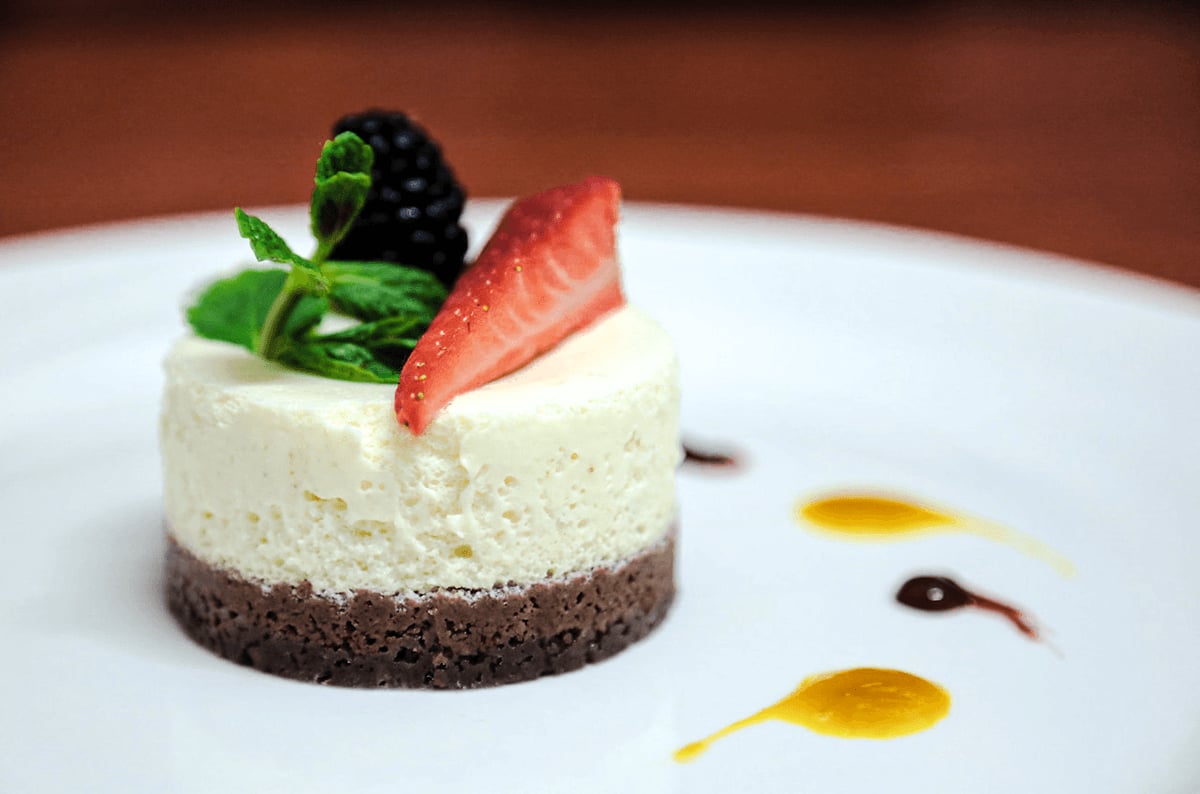
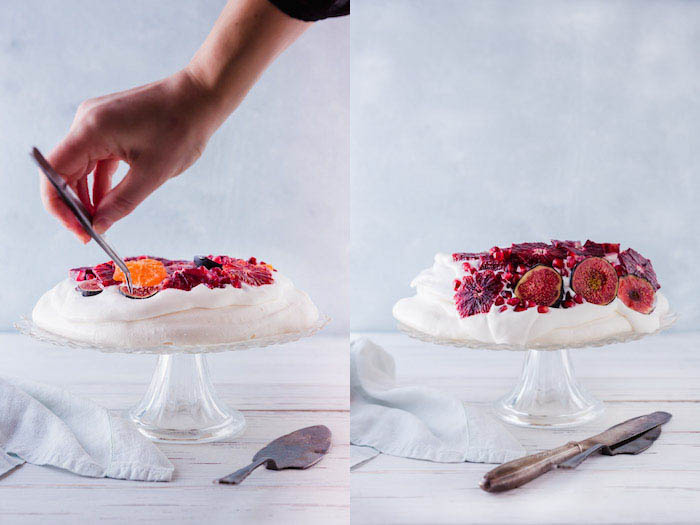
Social media pictures, or more “artsy” images will often lead to a different camera angle. The cheesecake below was for a social media post. It’s as much about creating a mood (and an appetite!).
A certain item might work better with an aerial photograph rather than a head-on photograph. Some restaurants might want you to show off their beautiful place settings as well as the food.
A 45-degree photograph above the food looking down will show you a wide area of background, which can be styled for maximum effect.
You can find a host of inspirational ideas in our guide to the top camera angles for photographing food.
© T P E Marshall
Cameras and Other Equipment
Choose a stance on camera gear for capturing culinary images, and I’ll locate a persuasive article confirming your viewpoint. Or wrong. So let’s unpick what you need to know about camera equipment.
In some cases you might have no choice. The agency I freelance for require nothing less than a full frame camera. If that’s the case, then you’re looking at quite a lot of money for a DSLR or, these days, a mirrorless camera.
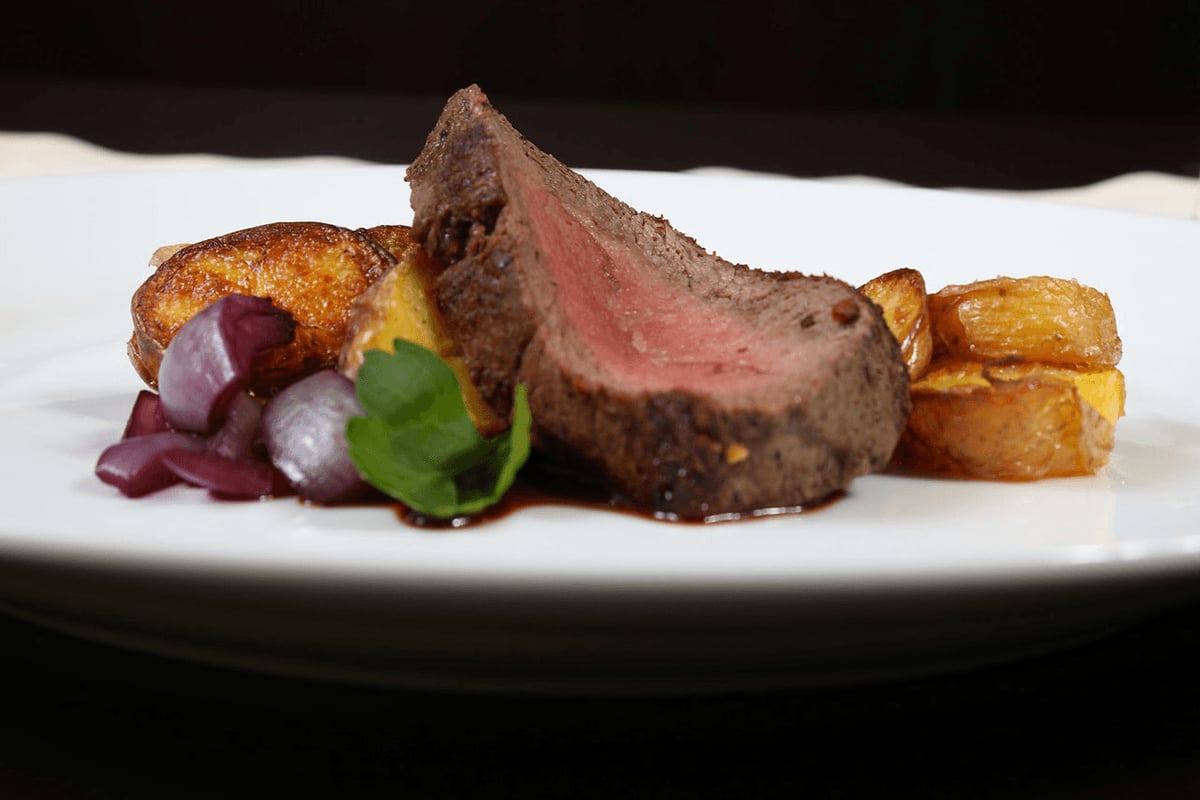
On the other hand, you can see from this shot of beef carpaccio below, that even a humble iPhone 8 can do well enough for many circumstances.
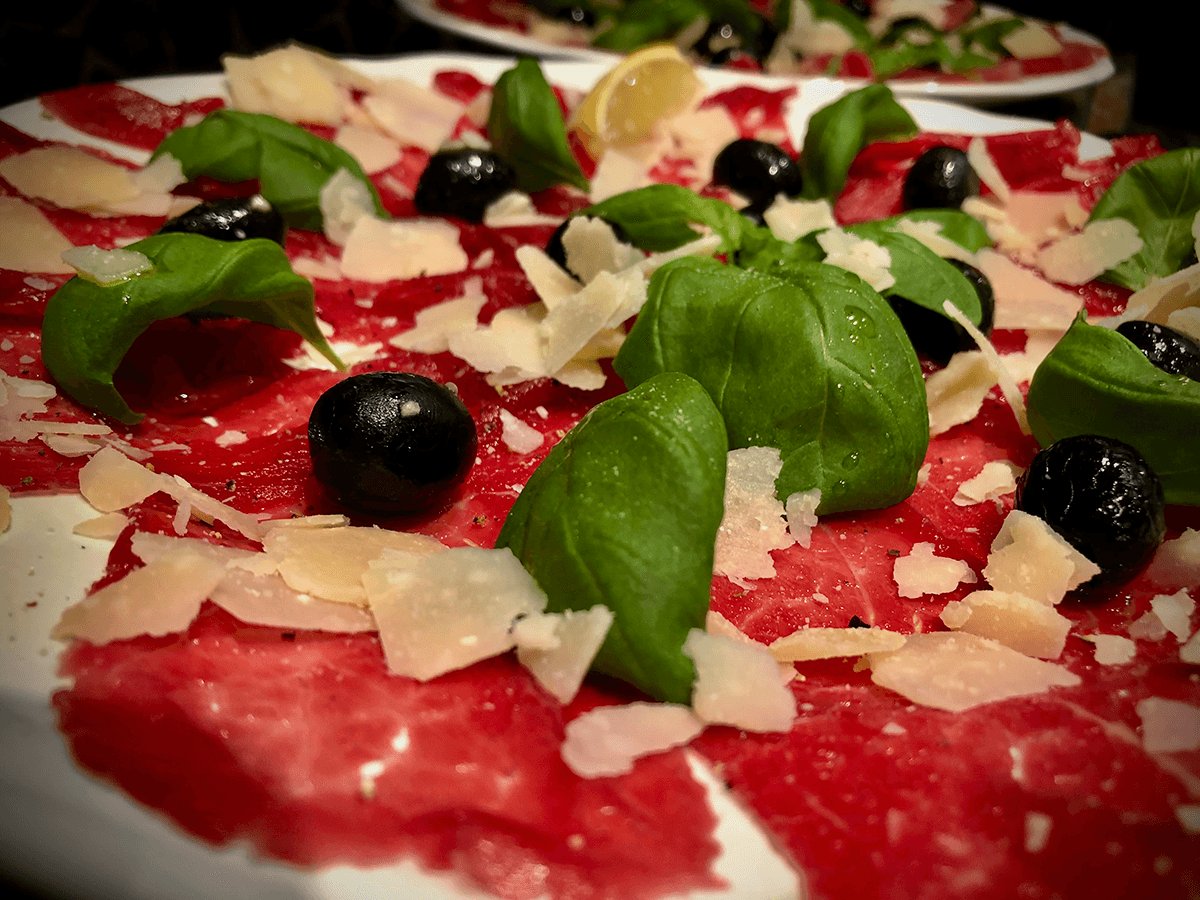
© T P E Marshall
The Best Camera for Taking Culinary Shots
It’s unlikely you’d run a culinary photography business using a smartphone. And there are many aspects of capturing culinary images that are consistent with most photography genres. And that means a good camera is a good camera.
On the other hand, you won’t need to pay a premium for some features. For example, absurdly high burst speeds, or eye-tracking autofocus aren’t needed.
Good manual focus control, high dynamic range, and ISO permanence are useful, though. We’ve put together a review of the best cameras for capturing culinary moments to help you if you’re looking for new kit.
Read our article for other important things that will determine if your camera is suitable.
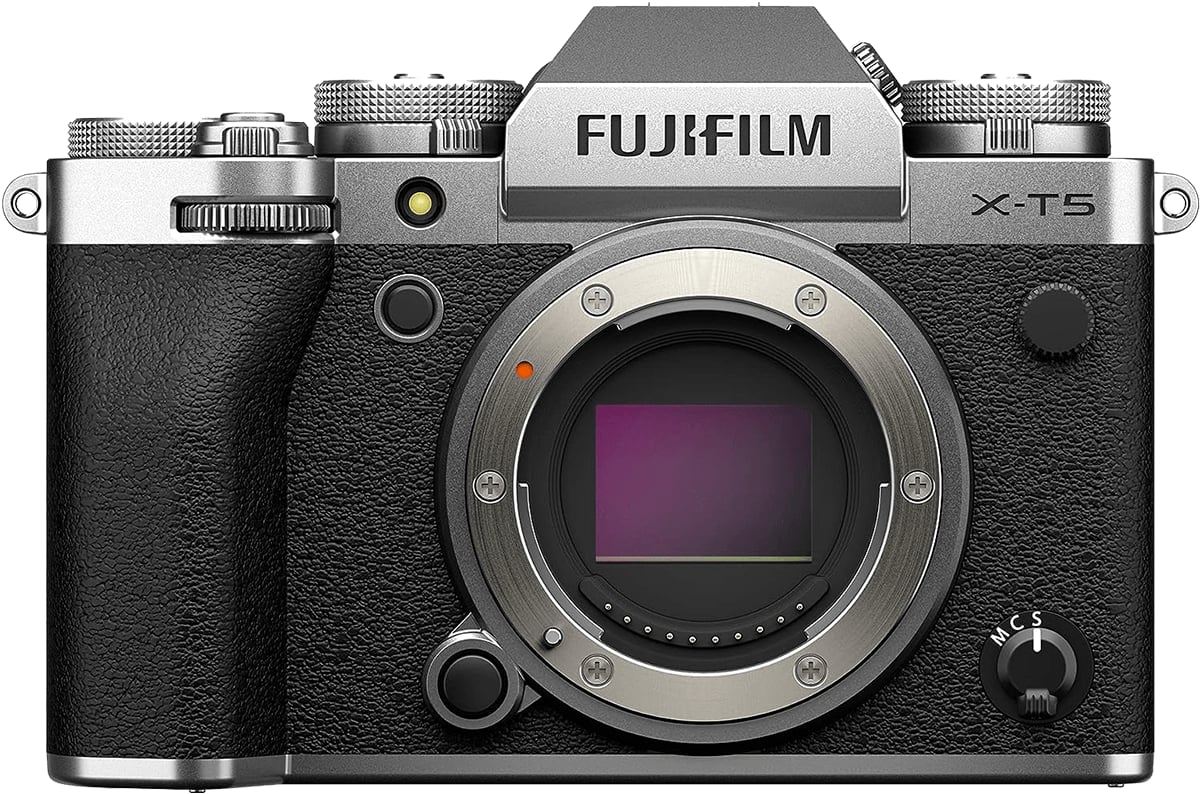
Our top pick camera for food photography
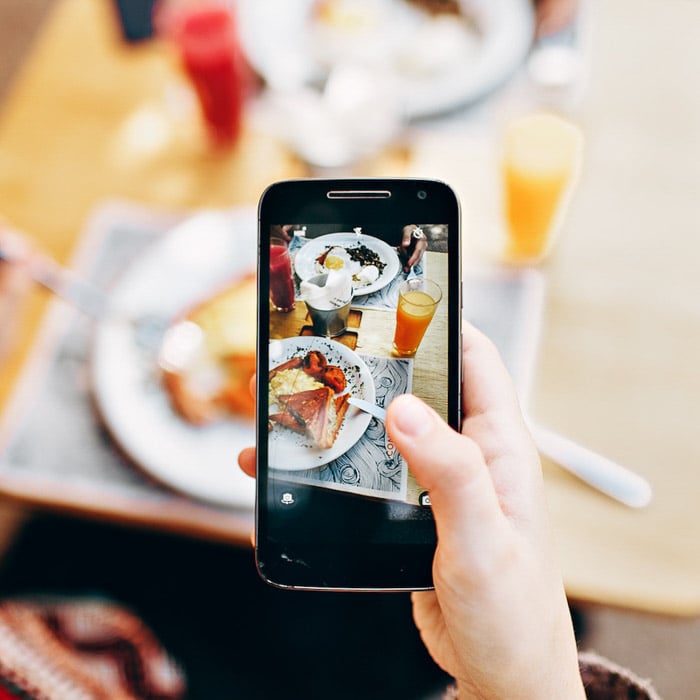
Capturing Culinary Images with Your Smartphone
We’ve put together a guide if you prefer to try photography of food using a smartphone. After all, using your smartphone has never been easier. They have competitive image quality, apps to help you post-process the images, and a slew of social media outlets to share.
As the article suggests, taking control of natural light is the key. If you look after the light, then the shadows will look after themselves.
The background you capture the meals on is just as important as the meals themselves. Great for creating a mood or tone, rather than just a blank, white area.
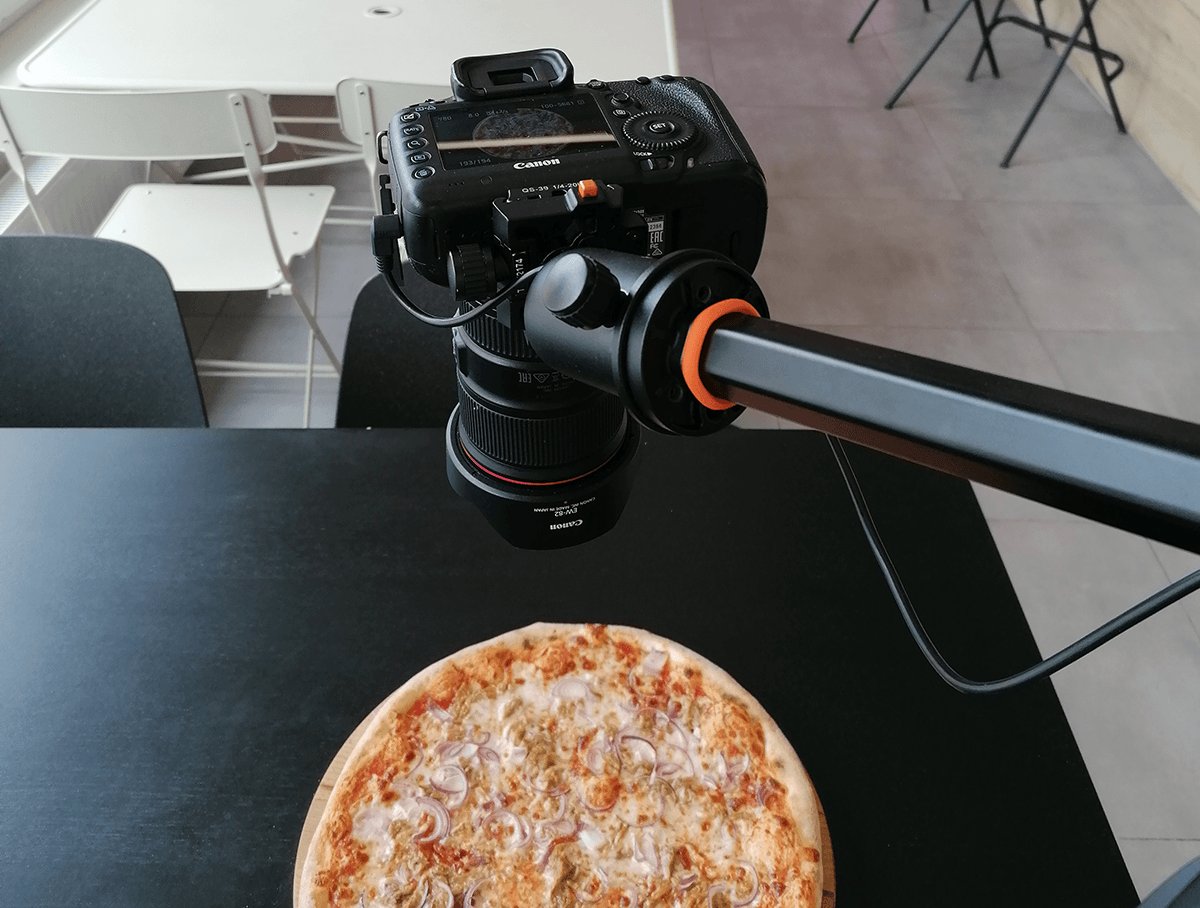
Selecting a Tripod for Capturing Culinary Images
There will be many situations where you need a tripod for photographing meals. It’s essential for overhead photos. And that kind of photo also requires a tripod with a tilting central pillar.
It is also a secure place to keep your camera while you are spending hours arranging a scene. And it ensures the perspective doesn’t change.
Having a tripod allows you to use manual focus, to make sure you have the focal point where you want it. This is necessary for image stacking (see post-processing section). We’ve put together a guide to the best tripod for capturing culinary images to help you choose.
© T P E Marshall
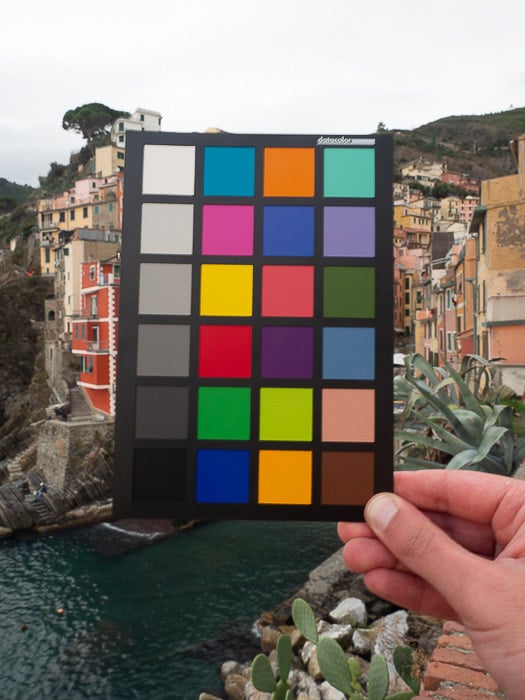
Using a Colour Checker in Capturing Food Images
Photography of food is all down to the details. This could mean shallow depth of field of a large dish, cuisine, and surrounding setting. It could also be those small elements that make up the image set.
Spices sprinkled around the dish, for example, can bring a wider impression of the food.
This is where color comes in. Colour management is very important in photography of food. They can either complement each other or cause an interesting juxtaposition.
To get these colors correct, we can set the camera’s white balance to the light temperature used. This becomes problematic if two different light temperatures are being used.
The white balance and color can be corrected during post-processing. This is where using a color checker in capturing images is important. It isn’t exactly cheap, but it helps you correct your color to the specifics of the shoot.
It is a little box that shows you many colors, which you photograph first before any other images are taken.
During post-processing, you correct the WB using the color checker image. Voila! It corrects everything to the colors they should be.
Selecting the Perfect Equipment for Capturing Images of Culinary Delights
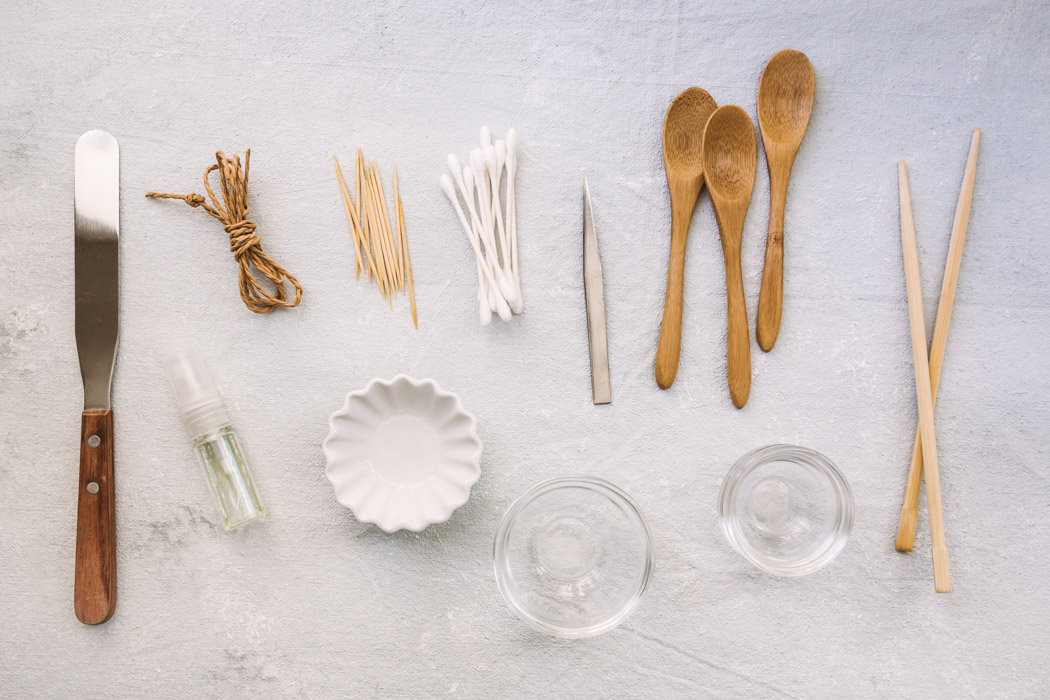
Apart from your camera equipment, tripod, and lenses, there are a few other things to consider. To help you move and style your images, you can really benefit from having the right tools for styling photography of food.
Paper towels are a must, for cleaning dishes and polishing glasses. They also blot up spills.
Tweezers are also necessary to move small, fine items and soft foods for precise placements. Cotton buds are great for cleaning, wiping and collecting random drops of liquid.
Brushes are also very important for oiling or adding water to an object. Explore our article to see how these tips on capturing food images can enhance your photos.
Darina Kopcok
Lenses for Capturing Images of Meals
Selecting the appropriate lens for capturing culinary images can be challenging. And the right lens will depend on the shoot and your budget. Realistically for capturing culinary images, you’ll probably find a zoom lens most useful. Being able to get close for some dishes, and wide for a large spread without changing lenses is a bonus. My 24-105mm f/4.0 lens is ideal for the task.
Wide-Angle Lenses
These are great for large spreads of food, where you might show meals for many people, and the table settings too. They work well in low light and can come in prime or zoom forms.
The disadvantage with these lenses is the distortion. You will find the image becomes warped close to the edge of the frame. This aberration can be interesting, and best used for fun projects.
They are tricky to use correctly, and best kept away from serious and professional shoots. Overuse of a wide-angle can look amateurish.
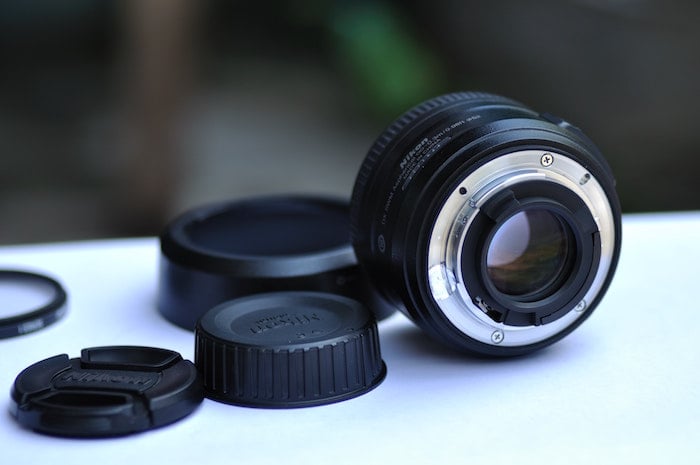
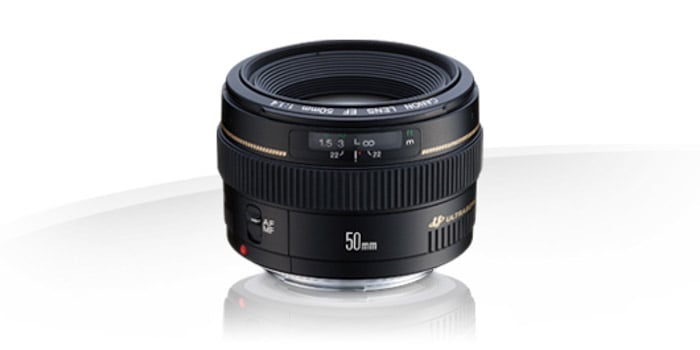
The 50 mm Prime Lens
There’s good reason to recommend a nifty fifty standard lens to every photographer. They offer great quality and still gives you a fairly decent wide view.
The distortion with this lens is minimal. Not only do they make your images look great, but they also cut down on post-processing time.
With a prime lens such as this, the quality and sharpness of the image are exceptional. They also go to very shallow depths of fields.
A narrow depth of field is great for taking attention away from a backdrop.
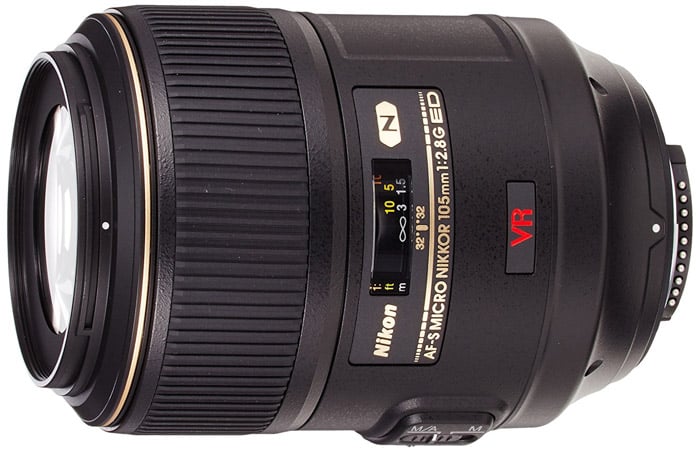
Macro Lenses
We usually think of a macro lens for nature or still life photography. Bit they are also excellent for capturing minute details in food photography. This type of lens gets you as close as possible as it has a very small minimum focusing distance.
You can use these in combination with macro extenders, to get in even closer. If you have a crop sensor, using this 100mm full-frame lens will give you a focal length of 160mm on a Canon DSLR (150mm on Nikon).
These are not easy to use in cramped spaces. This is unless you only use this lens for its macro capabilities. They will not work well for wide spreads of food from an aerial perspective unless only focusing on one or two details.
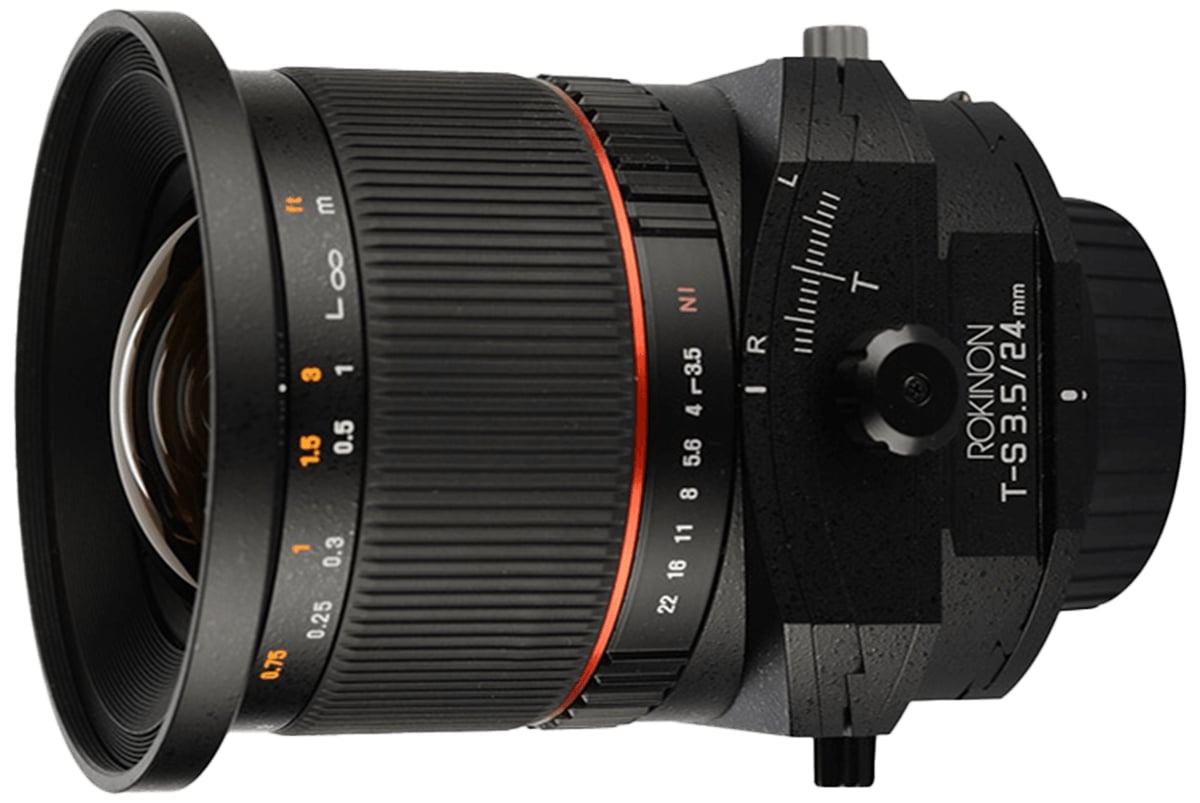
The Tilt-Shift Lens
It might seem odd to recommend a tilt-shift lens for capturing meal photos. But it creates interesting results. Tilt-shift lenses are very important in eliminating the parallax error found in architecture photography.
It works by allowing the photographer to change the parallel connection between the film/sensor plane and the lens plane. By manipulating this relationship, you create a focal point that works both horizontally AND vertically.
This is great for showing a slanted, diagonal focus or a focus spot rather than just a whole line.
These lenses are very expensive and tricky to use. We wouldn’t recommend buying one if you can’t use it elsewhere. If you have one, give it a try.
Creating Backgrounds for DIY Culinary Image Capturing
Capturing images of meals, just like any other form of product imagery, requires a setting. These can, of course, be real-life settings in a kitchen, dining establishment, or outside area.
Depending on the food choice and styling, you might decide that backgrounds or backdrops are necessary for capturing your dishes. In this case, you have two options. Either you buy them, or make them yourself.
DIY backgrounds enable you to create personalized settings for photographing your meals. Not only are they custom to your culinary capture, but they also won’t break the bank.
Darina Kopcok
Techniques and Tips for Enhancing Your Food Imaging
There are a lot of culinary photography tips and techniques you can use to get the best out of your work. This list is by no means exhaustive.
Once you get into the flow of things, it will give you a good sense of what food items go with what props and accessories.
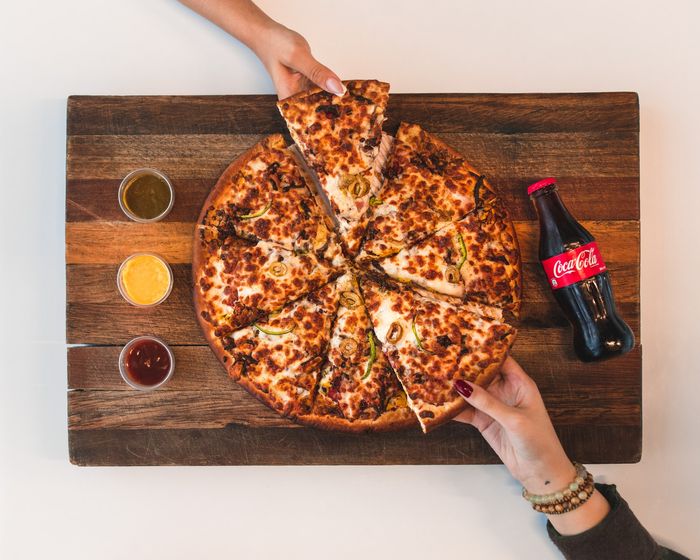
Simple patterns work well as background, especially if the food is plain and simple.
One of the best ways to style your food is to play around with place settings. This also incorporates napkins, cutlery, and drinks to help convey a mood. Sometimes the food speaks for itself.
© T P E Marshall
Solving Typical Challenges in Capturing Culinary Photos
Sometimes the requirements of a photography gig focused on culinary subjects will require some inventive approaches. If a shot has to be carefully styled, the ice can melt, or steam can disappear.
Instead of rushing, and having to correct mistakes in post-processing, there are some handy tips for capturing culinary creations you can use.
Ice cream, for example, will not last more than a few minutes without melting in front of a window or light source.
This is one of the reasons why photographers use mashed potato instead of ice cream. It is pliable and resembles the alternative, especially combined with food coloring.
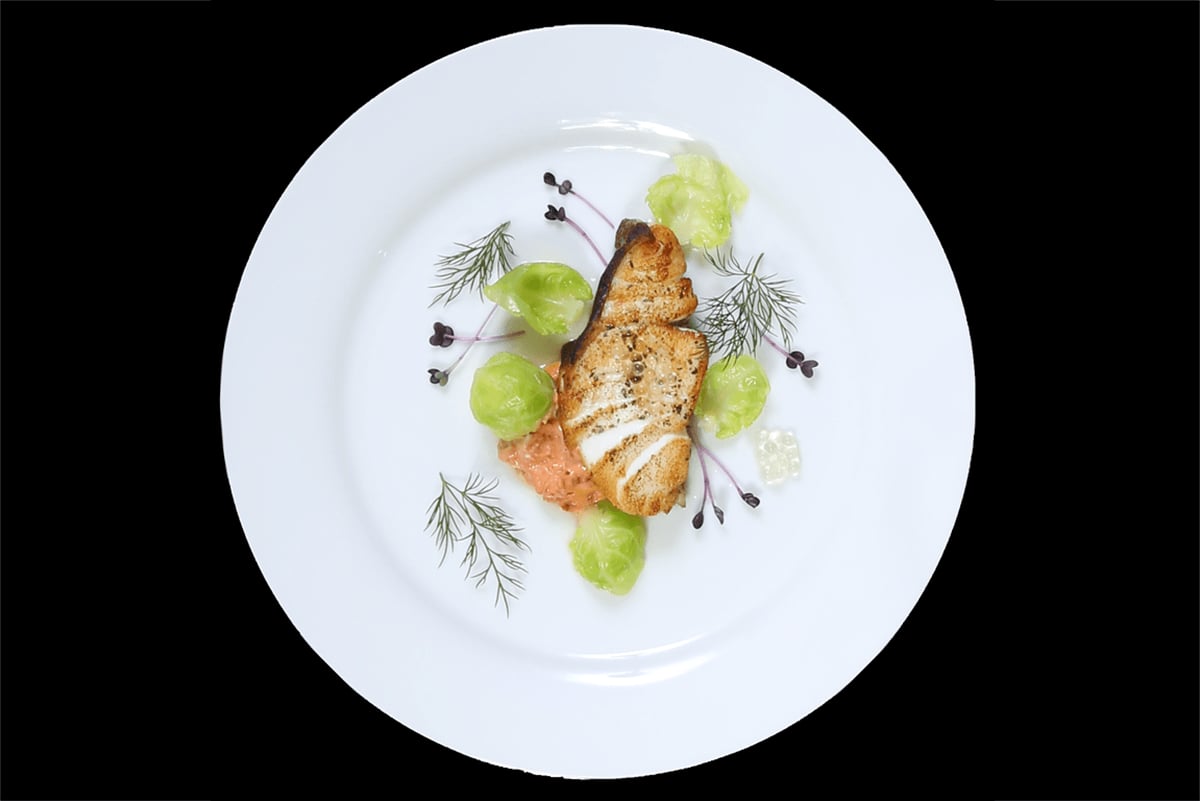
Editorial Restaurant Photography
Restaurants make some of the most fantastically styled food you’ll ever see. Not only do they have to impress the clientele, but they also have to wow those readers at home.
Editorial dining establishment photography brings styled dishes to the masses. This can be through newspapers, magazines, and social media.
They allow those not in the restaurant’s vicinity to see what is being created behind locked doors.
© T P E Marshall
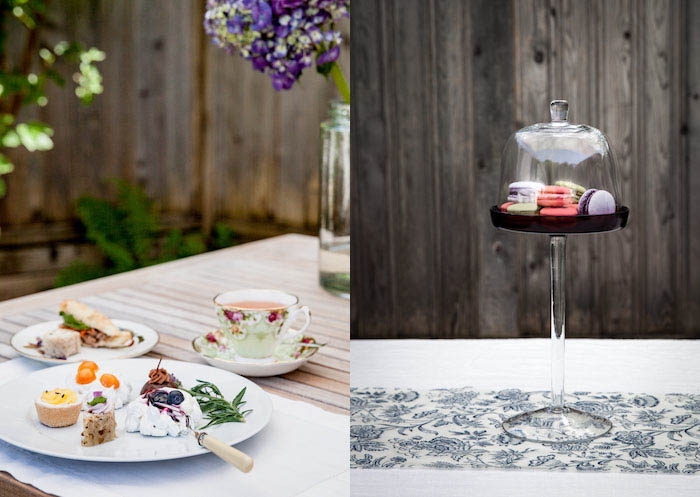
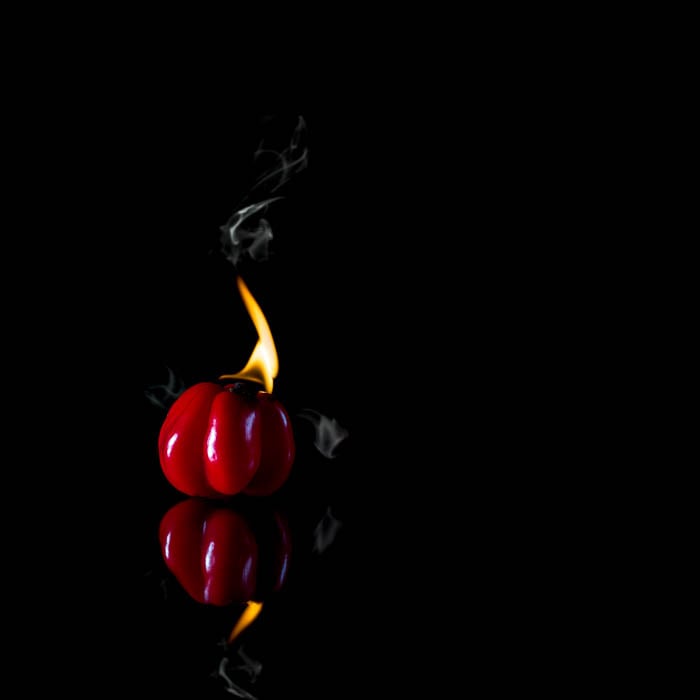
Utilizing Props and Backgrounds in Capturing Culinary Images
Props and backgrounds for photographing food can add a certain flair to your shoots. Sometimes it can be as simple as a vintage teacup. Or you might want to use colourful cutlery or some vintage items.
Not every photoshoot benefits from a flaming background. But sometimes you might want something a little dramatic!
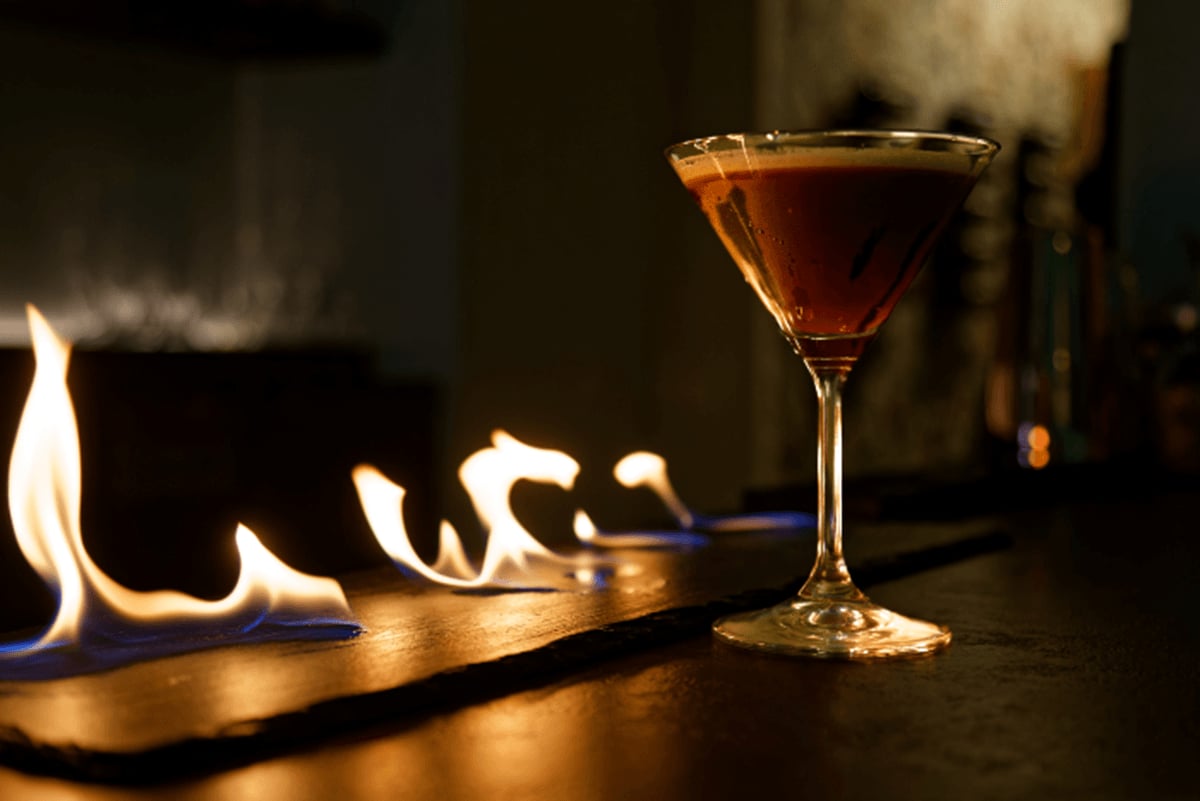
© T P E Marshall
Still Life Photos With Culinary Typography
Typography is a great way to separate your images from the rest. The great thing is that all food can be made to resemble letters, numbers, and characters.
If you have already started experimenting, this article can help you hone your skills. If typography within food photography is something new, you’ll find great inspiration here.
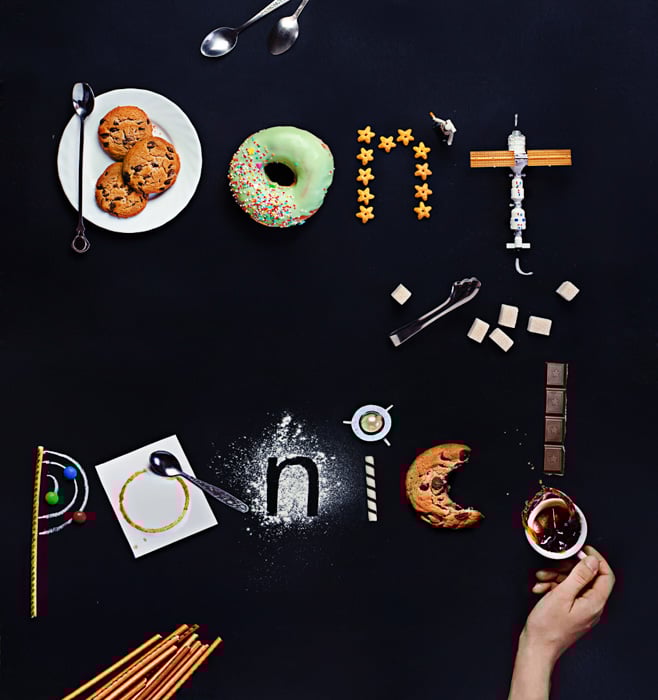
Dina Belenko
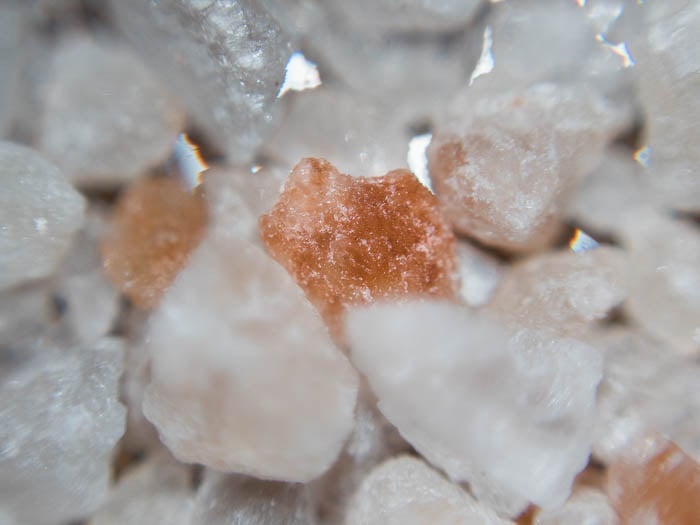
Closeup and Macro Shots of Culinary Creations
Your approach to capturing culinary delights might be more creative than a documentary. If so, you might want to get creative with close-up and macro imaging of culinary subjects.
By using a macro lens, you can get infinitely closer to your subject than a regular lens. This way, you can capture your arrangements and materials from different compositions.
As a bonus, you give your viewers something to think about. By getting closer, you change the idea and meaning of your subject.
Water Splash Imagery Techniques
Some images of meals are best captured straight on. By keeping it simple, you show the viewers how important the food is on its own.
But, some situations will call for more interesting situations. Water splash photography is a creative idea in itself. When combined with tips like this for photographing food, you aim to add flair to your food images.
Using this technique needs to be specific. Water splash photography isn’t something you would use for foods associated with dehydrated foods. Save it for fruits, drinks and anything that screams moisture.
It might just be the thing your photography of food scene needs.
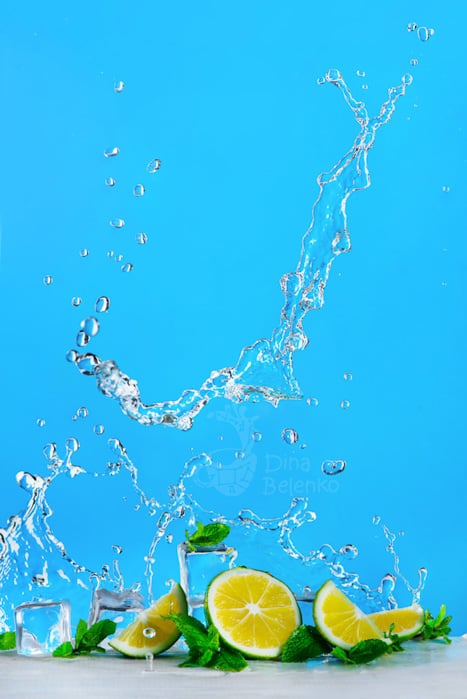
Dina Belenko
Working With Various Culinary Dishes
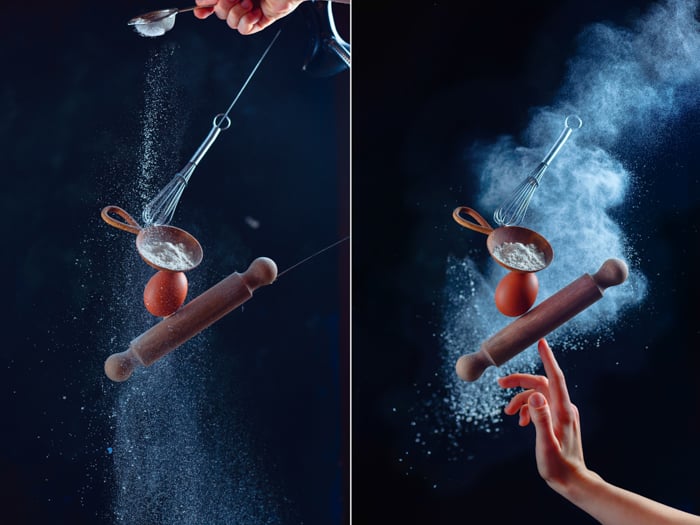
Some Simple Special Effects
Do you feel that your culinary snapshots are caught in a rut? Is there something missing from your scene, but you’re not quite sure what?
Have you thought about using flour clouds? A technique as simple as this can make all the difference.
By incorporating a splash of flour, you add action to the scene. After all, you’ve probably got flour readily to hand.
Capturing Your Cuisine: Incorporating Steam
Steam is an atmospheric addition to many photos. But it’s not always easy to capture in a photo. And that can be a problem if you want to show that your subject is hot. Have no fear, there are easy ways to capture it. And there are other ways that involve a little trickery. It’s up to you which one to use.
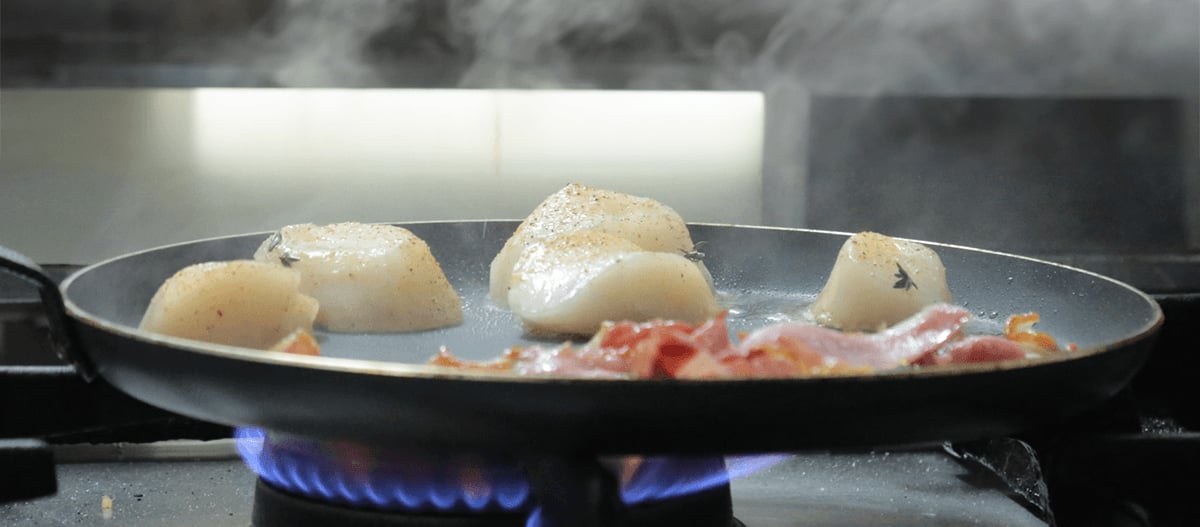
© T P E Marshall
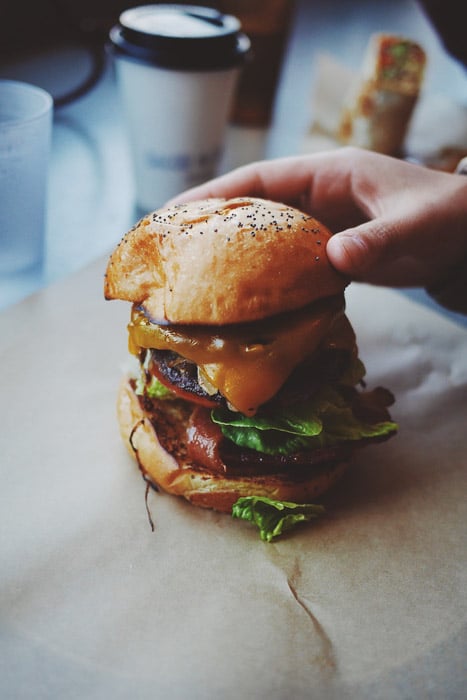
Styling a Burger Photo Shoot
Great burger photography is fifty percent styling, fifty percent photography. First, you need to decide if the images are for editorial, commercial or creative purposes.
For editorial images, the more realistic the better. This doesn’t mean you can’t add some elements to make your subjects look more appetising.
Try adding in grill marks to the meat or the bun. This adds something special to an otherwise ordinary shot.
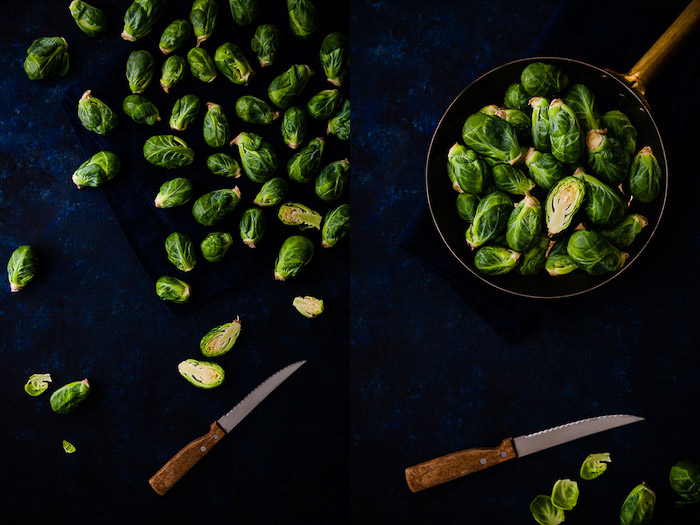
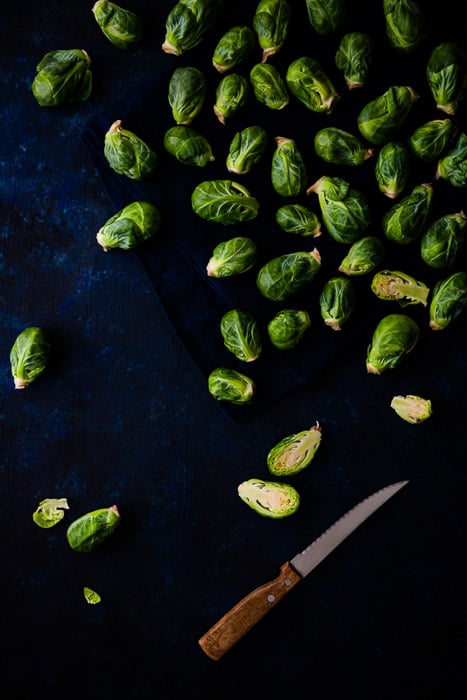
Vegetable and Fruit Picture Taking
If you’re looking for inspiration for your fruit and vegetable photography, you came to the right place. Beautifully organized and arranged food needs no introduction.
But, if you are capturing fruits and vegetables on their own, you might need some help. They could do with some interesting perspectives or compositions.
One area you should look at is color theory. The color of the fruit or vegetable should either complement or contrast that of the environment or backdrop.
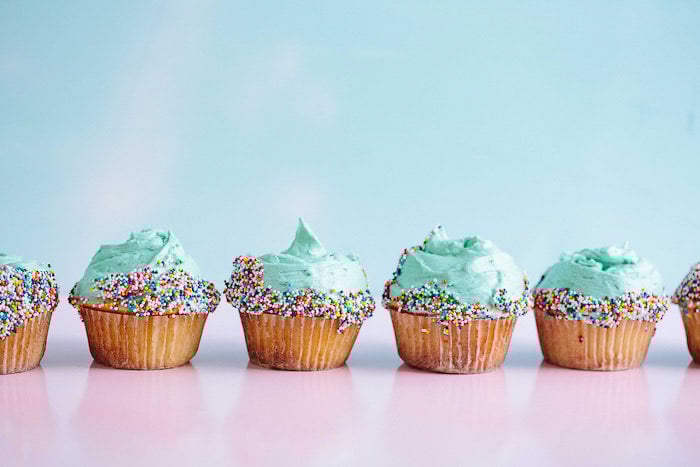
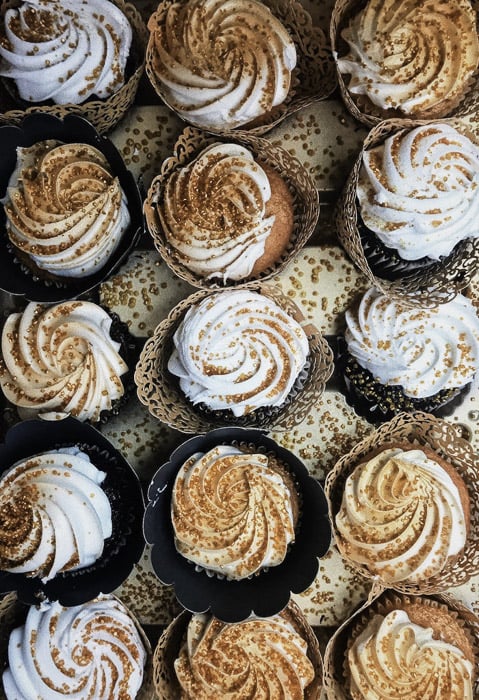
Cupcakes
You might argue that capturing images of cupcakes is as simple as it gets. The subject matter speaks for itself. But there are things you can do to take it to the next level.
You can capture cupcakes in very simple ways. Or you can do it in a more complicated. It’s all down to the message you want to convey through capturing images of culinary creations.
By keeping it simple, you create fewer distractions. Fewer distractions mean more attention to the little objects of joy.
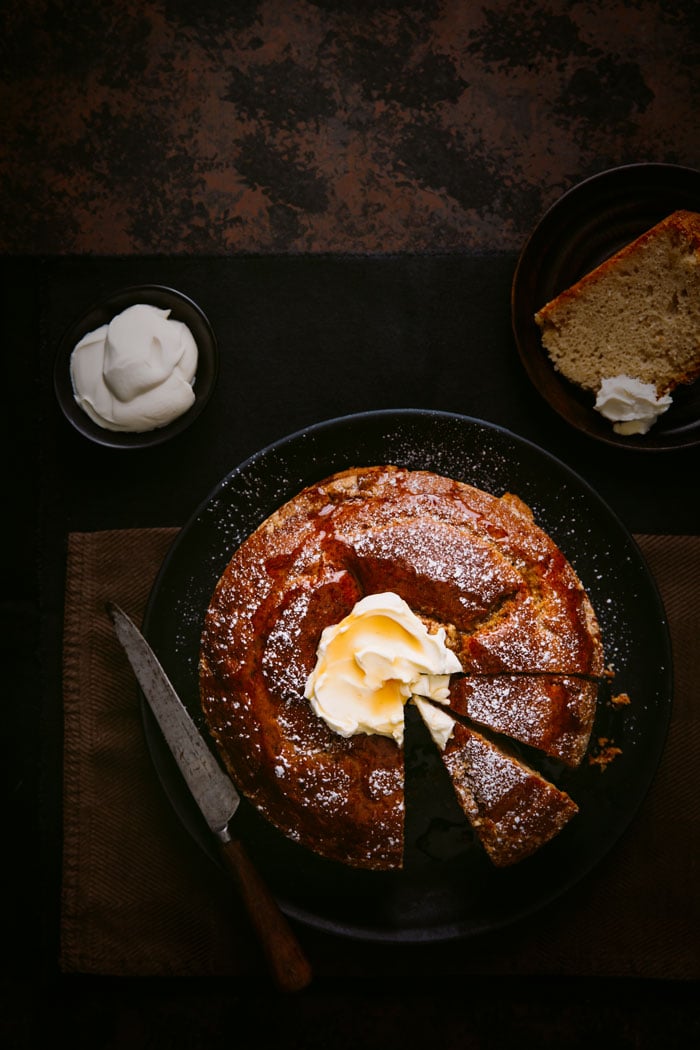
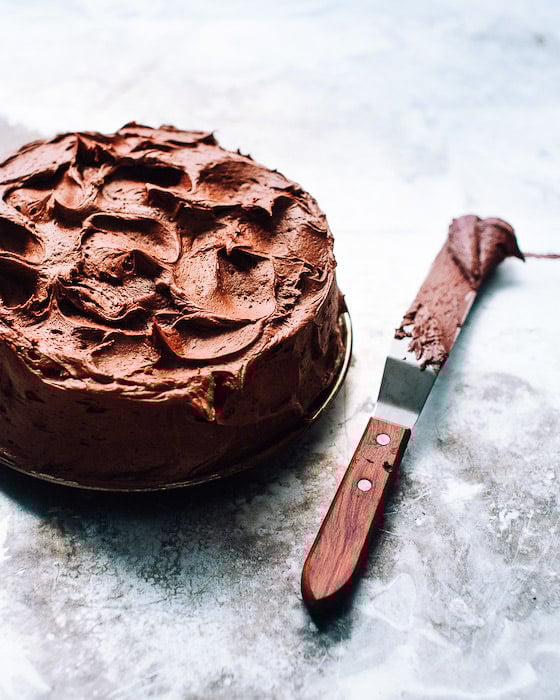
Cake Capturing Techniques
Cakes are some of my favourite food types. They incorporate, fruit, vegetables (carrot cake), chocolate, cheese, nuts, and even spices.
Nothing gets people’s mouths watering more than a delicious image of an inviting gateau. That’s the challenge of cake photography.
One of the best tips we can give you is to keep it very minimal. This directs more attention to the subject. Once there, they won’t be able to take their eyes off it.
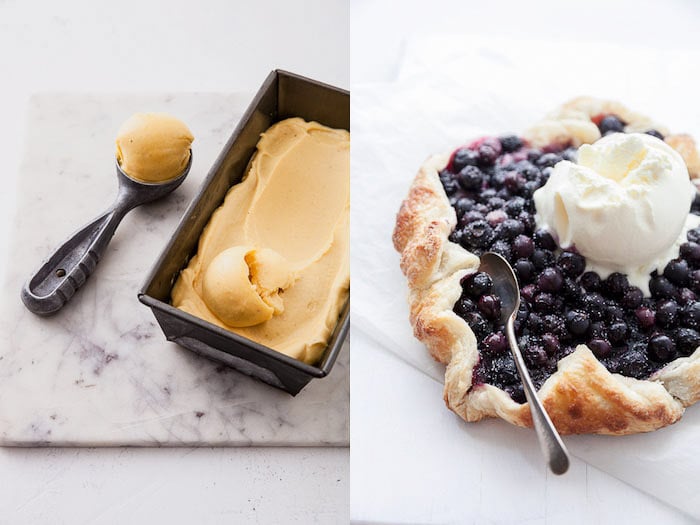
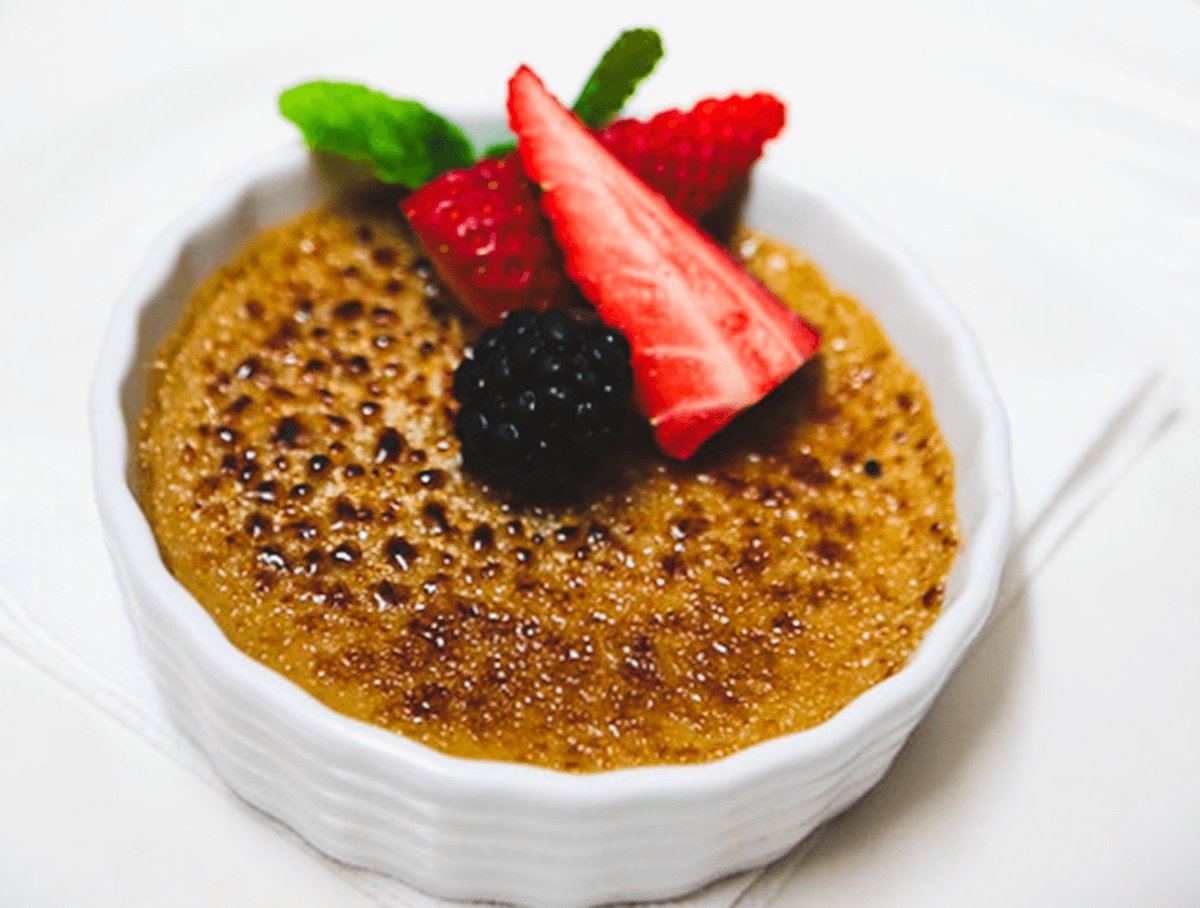
Dessert Capturing Techniques
There’s something deliciously indulgent about deserts. After all, noone needs a dessert. So it’s extra important to make sure your dessert images are as tempting as can be.
That might be down to lighting, camera angles, staging—or all those things. The challenge is to get those mouths watering!
© T P E Marshall
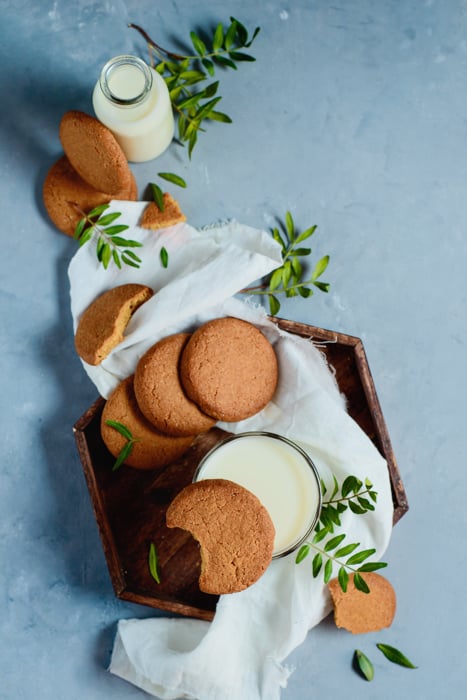
Don’t Forget the Cookies
Cookies might be simple, but you can still be creative with your cookie photography.
First, decide on your goal. What are the images for? This will let you know how creative you can be. Cookies have a very strong connotation of comfort, for example.
One great idea is to use the circular concept for composition and styling.
Chocolate
Taking pictures of chocolate might look like the easiest thing to capture. Just break up a few pieces and dot them around the scene.
While in some instances it isn’t complicated, there are many things that you need to know. Such as the lights you use might actually melt your subject.
You might need to use heat in some circumstances. But having control is much better than letting the chocolate chips fall where they may.
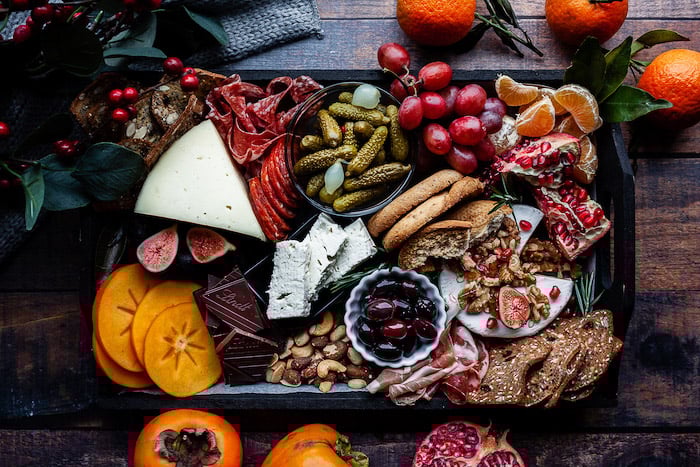
Holidays and Capturing Culinary Images
Holidays often provide some of the best inspiration for food photography. Whether it’s having the family round for a special meal. Or diving into exotic cuisine at your vacation destination.
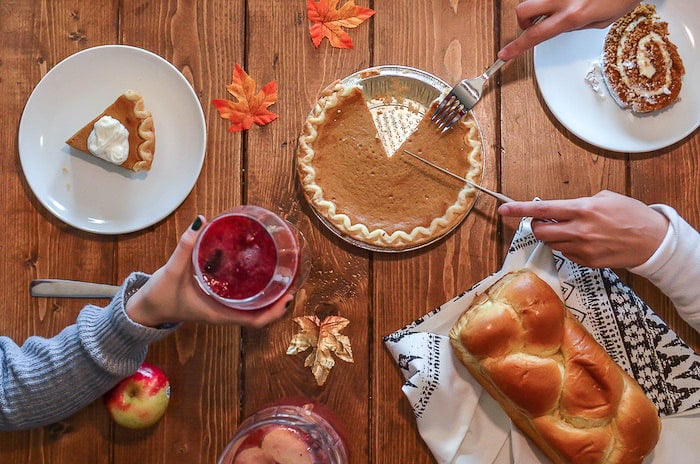
Thanksgiving Photography Tips for Culinary Delights
For some holidays, food plays a huge part in celebrations and festivities. Thanksgiving food is central to this holiday, and sharing the time together.
To capture food for a specific holiday needs more than an interesting perspective. The table and the surrounding area need to be styled in a particular way.
Christmas is another holiday that also focuses on food. Both, the big meal and all sorts of candies, desserts, and nicknacks throughout the holiday. You might want to try your hand at capturing some Christmas still life images.
Due to the levels of excitement, and the relaxing downtimes, this is a perfect time to experiment. With traditional baking and festive experiments.
On the plus side, any images you capture this year could very well be the cards you send out next year.
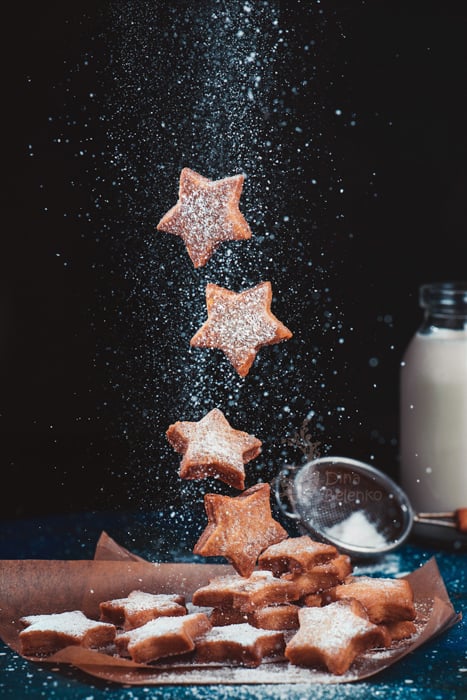
A fun example is the fun you can have with Christmas cookies photography. Here, you get to meld together the festive nature of the holiday with a simple subject.
To make them more interesting, why not get them to levitate? Just raise your wand and repeat the lines Wingardium Leviosa. Or use the simpler solution our article suggests.
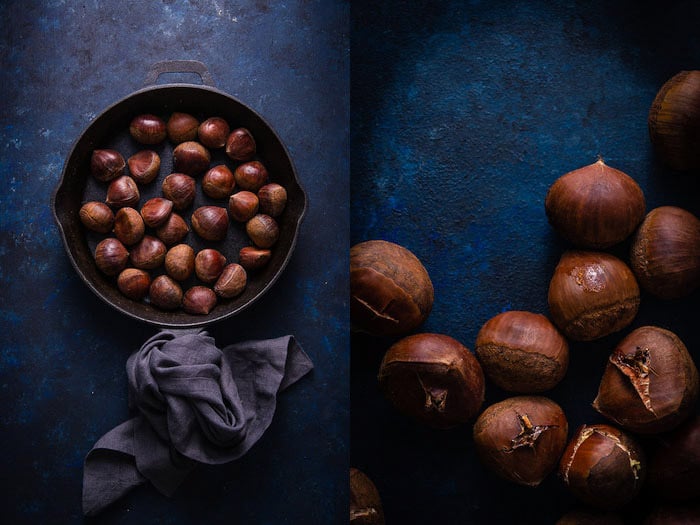
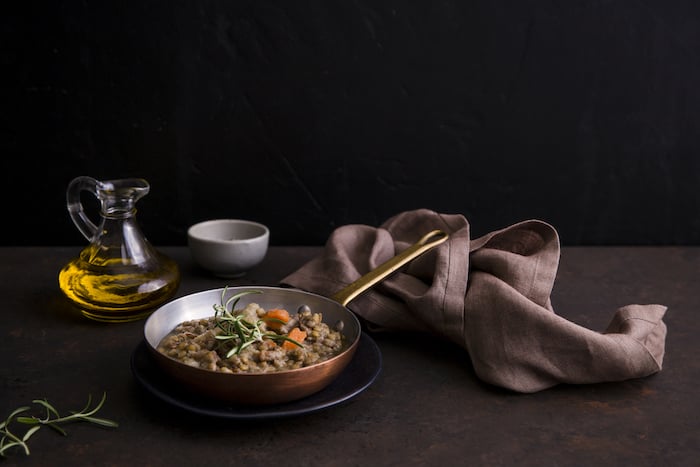
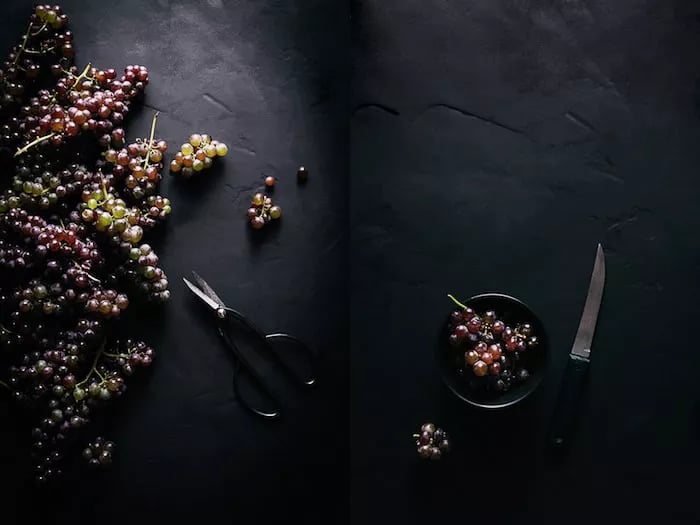
Styling and Capturing Images of Dark Cuisine
So far we have looked at lighting dishes with an abundance of light. What about experimenting with some dark photography of food that has a sullen mood to it?
A meal prepared for the winter season could benefit from this. Or even spectacular dishes for Halloween.
Here, we swap out all of the light backgrounds and colors for greys, dark browns, and blacks.
The color shifts, so the reflected light is less and bounces back with the darker colors.
You might find using flags (cardboard to stop light) useful in limiting the amount of light that hits the culinary subjects. Read our article for a step by step guide.
Creative Ideas for Photographing Your Meals at Home!
There are lots of creative ideas for capturing culinary images you can try. A great way to make your photography of food stand out is to layer objects. Use a plate, with a smaller plate on top. This brings back a little 3D into our 2D image.
Using the power of triangles also helps to add interest. Two objects are too even and four is too many. Three is a powerful number, and it works well.
Delicious Photo Examples of Cuisine to Inspire You
There is an infinite amount of things you can make to photograph. Sometimes, having so many options means it is difficult to choose.
Our article here provides you with delicious examples. They are more than enough examples to get you started on your path to beautiful meal photography.
Darina Kopcok
Inspiring Blogs on Capturing Culinary Images to Follow
Capturing amazing images of food is a pleasure in itself. Although, if you are looking to turn it into a business, it can be helpful to see what else is out there.
We have compiled a list of the top blogs on photography for food that you need to follow. Not only will they serve as inspiration, but they can show you the niches that are still available.
For business or pleasure, you can get a lot of help with photographing food from our article.
Olive & Mango by Joanne Rappos
Post-Processing
Understand Your Camera's Histogram for Enhanced Culinary Photo Taking
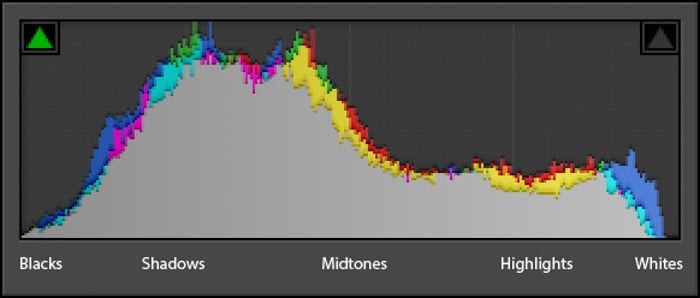
There is one crucial area not to ignore when photo editing or post-processing culinary images. This is the histogram.
The histogram has a place on your camera and in post-processing software on your computer. Its purpose is to show you the tonal range of your photograph and where the values lie.
They focus on blacks, shadows, mid-tones, highlights, and whites.
This clever little box also tells you if you have too much black or white in your image, which is over or underexposure.
Understanding the tonal ranges help you fix them. Both in camera and during post-processing. Knowing the information they display is one of the best culinary photography tips we can offer.
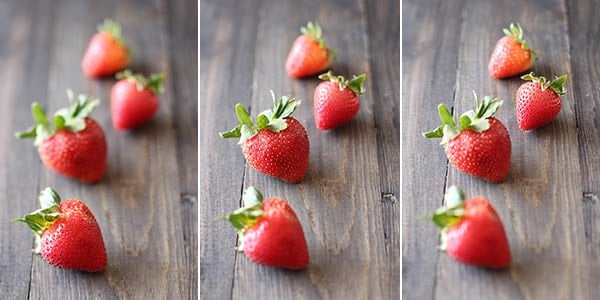
Use Focus Stacking for Sharper Photos
Focus stacking is a relatively easy concept. The basic idea is that, while using a very shallow depth of field, you capture one small part of the culinary item.
You keep the camera exactly where it is and then refocus on another part of the item. After a few photographs, you should have successfully photographed the entire item in focus.
These images are then ‘stacked’ together using post-processing software.
After this process, you should have an image where the focus blankets the item but leaves the background blurred and out of focus.
This is a great way to keep a high-quality differential focus over a wider area. You are welcome!
Fine Art Techniques and Tips for Capturing Culinary Creations
Fine art photography covers many different photographic fields. Food photography is no different. If you own and run a fine art business, consider capturing images of cuisine as a subject.
Plenty of art lovers display culinary-related pictures in their kitchens and dining rooms. The fine art imagery of food market is definitely worth breaking into. Like a tasty crème brûlée.
In our article, you’ll find all the tips and techniques you’ll ever need.
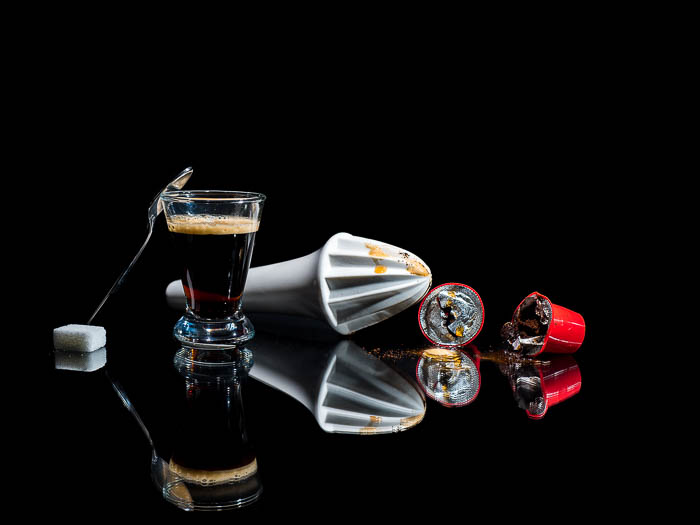
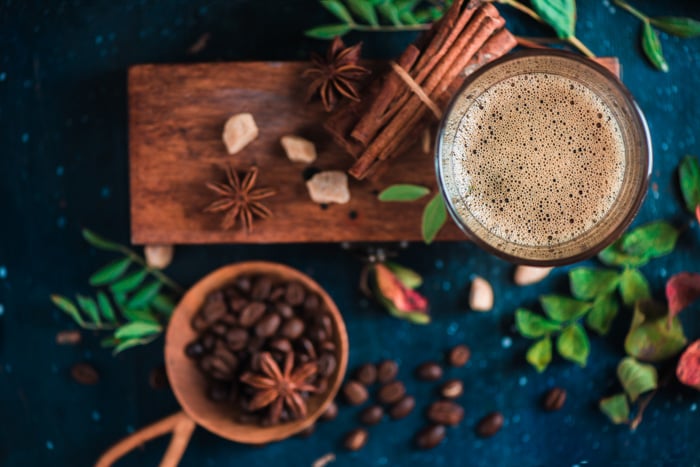
Stunning Coffee Captures
Capturing images of coffee is an art unto itself. There are many different brands, flavors, and areas that separate the cups of black gold.
All of these serve as great additions to your coffee photography scenes.
For inspiration, tips, and techniques, your prayers for photographing food related to coffee have been answered.
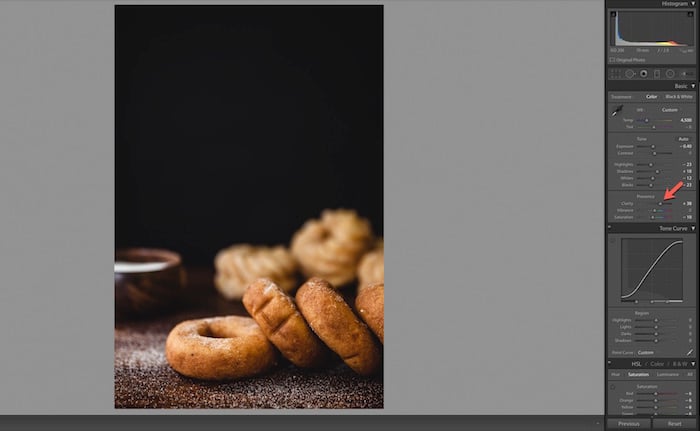
A Beginners Guide to Culinary Photo Editing in Lightroom
Adobe Lightroom is a great software package for post-processing your culinary images. It has a great library system, where you can organize hundreds and thousands of images.
Another helpful element of this program is its great use of keywords and tags.
It also lets you modify your images in a non-destructive way. This allows you to go back to the original image if you no longer like the edits you created.
Lightroom has a no-nonsense layout and is very user-friendly. You are able to adjust settings such as exposure and contrast very easily. This should be your go-to package.
To become a master of photography editing, try our Effortless Editing course!
Editing Culinary Images in Photoshop
Lightroom is great, but sometimes you need more options. That’s when Adobe Photoshop is great for enhancing your culinary images.
Photoshop is a software better designed for labour-intensive images. Especially where text or layer masks might help you achieve what you want.
Most professional photography experts find they benefit from Lightroom’s library system and simple adjustments.
Then import the image into Photoshop for airbrushing and other complicated modifications before exporting the final result. And with the advent of generative AI, your options are even greater.